
The average Winchester home sold for £463,025 in July, a second straight monthly fall. June's figure has been revised down by £3,401 since it was published.
The average home in the Winchester district sold for £463,025 in July 2026. That is £4,710 less than in June, and the second monthly fall in a row.
The headline in the new UK House Price Index still reads as growth. Prices are up 2.1 per cent on July last year. Look past it and the district has given back £13,303 since May.
There is a second thing in this release that did not make any headline. June’s figure has been revised down. When it was published a month ago it read £471,136, a rise of 4.6 per cent on the year. It now reads £467,735, a rise of 3.8 per cent. That is £3,401 off the price and 0.8 percentage points off the growth rate, in one correction.
This is normal and it is worth understanding. The index is built from completed Land Registry sales, and sales keep arriving after the first estimate is published. Every month the previous months move. It is the reason to treat a single monthly figure as a first draft.
Where the district actually is
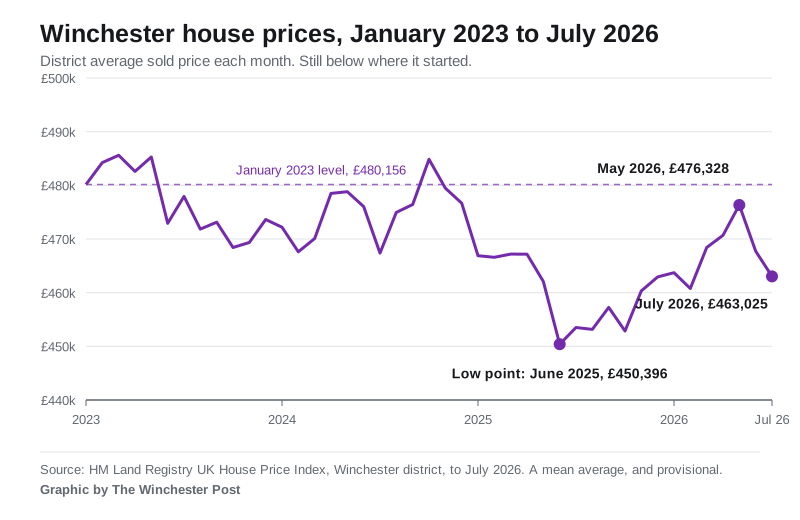
The index uses January 2023 as its base. In that month the district average was £480,156. Three and a half years later it is £463,025, which is £17,131 lower in cash, before any allowance for inflation.
The shape in between is a fall, a floor and a partial recovery:
- June 2025: £450,396, the lowest month on this chart
- May 2026: £476,328, the best month of the recovery
- July 2026: £463,025
Prices are also a long way below the £493,584 the district reached in August 2022.
None of that makes Winchester a weak market. It makes it a market that went up early, came down, and has not got back.
Flats are the part that has not moved
The average covers everything from a studio in Winnall to a farmhouse on the downs, so the split by type is where the useful detail sits.
| Property type | Average price | Change on the year |
|---|---|---|
| Detached | £746,246 | +2.0% |
| Semi-detached | £469,390 | +3.1% |
| Terraced | £390,267 | +2.9% |
| Flat or maisonette | £229,970 | −0.2% |
Source: HM Land Registry UK House Price Index, Winchester district, July 2026.
Flats are the only type worth less than a year ago, and the gap opens up over the longer run. A Winchester flat averaged £250,815 in January 2023. It now averages £229,970, which is £20,845 less, a fall of 8.3 per cent, while the district as a whole is down 3.6 per cent over the same period.
If you own a flat here, that is the number that matters, not the headline. If you are buying your first one, it has moved in your favour.
What a first home costs, and what the next step costs
A first-time buyer in the district paid an average of £345,021 in July, up 2.3 per cent on the year. Someone moving from one home to another paid £559,458, up 2.1 per cent.
The £214,437 between those two figures is the real price of the second move in Winchester, and it explains a lot about who stays and who leaves.
Buyers paying cash averaged £466,475. Buyers with a mortgage averaged £461,754. The two are unusually close, which is not the pattern in most expensive districts.
How Winchester compares
| Area | Average price | Change on the year |
|---|---|---|
| Winchester district | £463,025 | +2.1% |
| East Hampshire | £440,541 | −1.2% |
| Test Valley | £368,131 | −0.6% |
| Eastleigh | £310,283 | +2.6% |
| Hampshire | £364,336 | +0.9% |
| South East | £380,878 | +0.2% |
| England | £293,479 | +1.1% |
Winchester remains the most expensive district in this group by a wide margin. It costs £98,689 more than the Hampshire average and 58 per cent more than the England average.
It is also one of only two areas in the table still rising faster than England as a whole. Both of its neighbours to the east and west, East Hampshire and Test Valley, are now falling year on year. Eastleigh, at less than a third of the price per home, is rising slightly faster than Winchester.
What it means for you
Three practical points.
If you are selling, the last three months of this index are the least reliable part of it. A May or June comparison you were quoted in the summer may already have been revised. Check the current figure before you price on it.
If you are buying a flat, you are buying into the one segment that has not recovered since 2023. That is a risk and an opportunity, and which one depends entirely on how long you plan to stay.
If you are comparing figures, remember the UK House Price Index is a mean average across the whole local authority, not a median and not the city alone. It includes Alresford, Bishop’s Waltham, Denmead, the Worthys and the Meon valley villages. Portal averages for “Winchester” usually cover a smaller, dearer search area and will read much higher. Our guide to Winchester house prices sets out why the two differ and by how much.
Every completed sale in England and Wales is public, so you can check a specific street yourself on HM Land Registry Price Paid.
Sources
- UK House Price Index, Winchester district, July 2026, HM Land Registry.
- Land Registry open data service for the monthly series from January 2023, the revised June 2026 figures, and the comparator areas.
- HM Land Registry Price Paid search for individual addresses.
UK House Price Index figures are provisional and are revised as more sales complete.
Have your say